Important Scrum Metrics for Project Success
A Scrum project can look busy without actually moving forward. Stories are being worked on, meetings are happening, and the Sprint board is full, but are you getting closer to the outcome that matters?
That is where Scrum metrics become useful.
The right metrics help teams understand delivery, predictability, quality, and bottlenecks. Atlassian recommends choosing metrics based on the team’s context and using them to support planning, decision-making, and continuous improvement rather than treating them as a universal scorecard.
Why Scrum Metrics Matter
Metrics give teams evidence instead of relying entirely on assumptions.
For example, if a team repeatedly carries unfinished work into the next Sprint, the problem may not be developer productivity. It could be oversized stories, unclear requirements, dependencies, or unrealistic Sprint forecasts.
A useful metric helps the team identify the pattern. The real value comes from the conversation and action that follow.
Atlassian highlights velocity, burndown, cycle time, cumulative flow, and Sprint reporting among the metrics that can help Agile teams understand delivery and improve their workflow.
1. Velocity for Better Forecasting
Velocity represents the amount of estimated work a Scrum Team completes during a Sprint. Looking at velocity across multiple Sprints can help teams forecast how much work they may realistically handle in future Sprints.
For example, a team with recent velocities of 26, 29, 27, and 30 story points has a useful historical range for planning.
But velocity should not become a target.
Two teams with velocities of 30 and 50 aren’t necessarily performing differently. Story-point estimates are team-specific, so comparing velocity between teams can produce misleading conclusions.
Use it for: forecasting and Sprint planning.
Don’t use it for: ranking teams or individual developers.
2. Burndown Chart for Sprint Progress
A burndown chart tracks the amount of work remaining during a Sprint and helps teams assess whether they are likely to achieve their Sprint Goal.
A sudden period with little movement may prompt useful questions:
- Are items blocked?
- Are stories too large?
- Is testing happening late?
- Has the Sprint scope changed?
The chart doesn’t diagnose the problem. It makes the pattern visible so the team can investigate it.
3. Sprint Report for Understanding Commitment
A Sprint Report shows work completed and work returned to the Product Backlog. It can help a team examine whether it is consistently overcommitting or dealing with changing scope.
This is especially useful when a team repeatedly plans more work than it can finish.
Instead of simply asking, "Why didn’t the team complete everything?", a better question is:
"What can we learn about how we forecast and manage Sprint work?"
That creates a much more productive improvement conversation.
4. Cycle Time to Find Delivery Delays
Cycle time measures how long work takes from the point it starts until it is completed.
Atlassian’s Control Chart uses cycle-time information to help teams understand delivery patterns and identify opportunities to improve predictability.
Imagine most work items take three days to complete, but some take ten days. That difference deserves investigation.
Possible causes could include:
- Technical dependencies
- Waiting for reviews
- Testing bottlenecks
- Large work items
- Frequent interruptions
Reducing unnecessary waiting can improve delivery without simply asking developers to work faster.
5. Cumulative Flow for Identifying Bottlenecks
A Cumulative Flow Diagram (CFD) shows how work items move through different workflow states over time. Atlassian notes that growing areas in a particular state can help teams spot potential bottlenecks.
For example:
To Do → Development → Testing → Done
If the Testing section keeps expanding while Done remains relatively flat, the team may have a testing constraint.
The metric turns an invisible workflow problem into something the team can examine.
6. Sprint Goal Achievement
Not every important measure is a chart.
A Scrum Team should also consider whether it achieves the Sprint Goal.
A team might complete many individual tasks while failing to deliver the intended outcome. Conversely, it might complete fewer planned items but still achieve the Sprint Goal.
This is why counting completed tickets alone can provide an incomplete picture of project success.
7. Quality Metrics
Delivery speed means little if the product becomes less reliable.
Teams can also examine indicators such as:
- Defects discovered after release
- Critical bugs
- Reopened issues
- Customer support problems
- Defects deferred to future releases
- Automated test coverage, where relevant
Atlassian identifies quality as an important dimension of Agile measurement alongside delivery metrics.
Quality trends can reveal whether a team is actually improving or simply completing work faster.
Don’t Turn Metrics Into Targets
This is one of the most important rules of Scrum measurement.
If velocity becomes a performance target, teams may increase estimates. If teams are judged by the number of completed tickets, they may prioritize smaller tasks over valuable outcomes.
Atlassian explicitly cautions against using Agile metrics as weapons for comparing teams or forcing behavior. Metrics are most useful when they provide context for improvement.
A good Scrum Master therefore asks:
"What is this metric telling us?"
Not:
"Who is responsible for this number?"
Which Metrics Should You Track?
A practical Scrum dashboard could include:
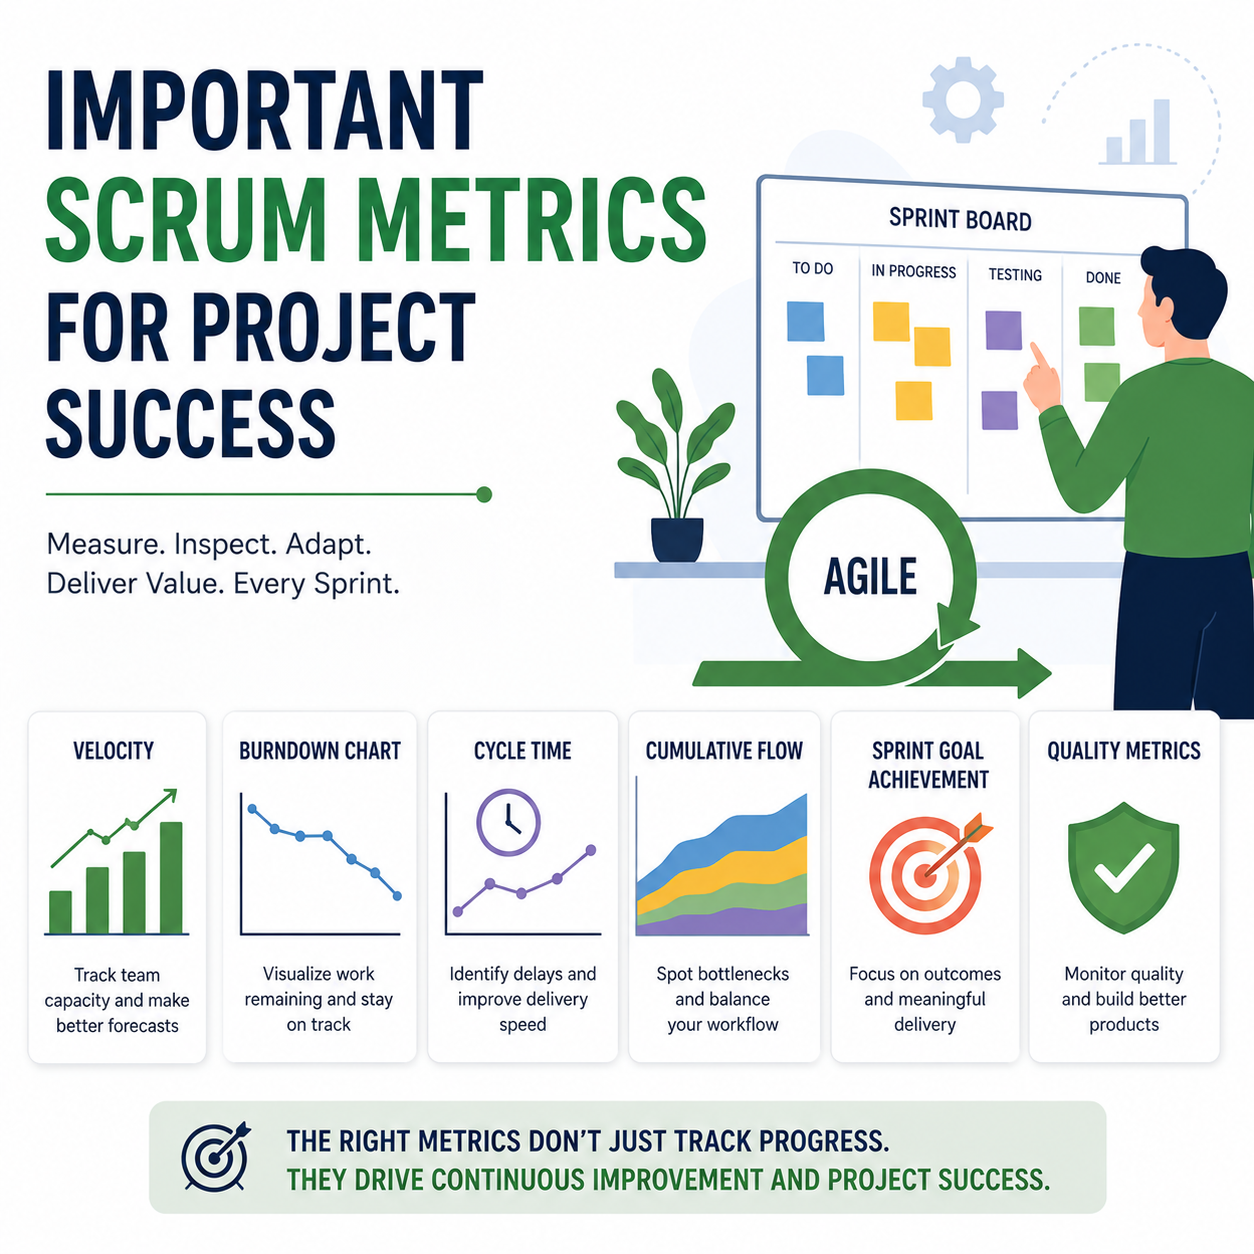
Here’s the same information in content form:
- Velocity: Used to forecast the team’s future capacity based on the amount of work completed in previous Sprints.
- Burndown: Helps monitor Sprint progress by showing how much work remains over time.
- Sprint Report: Helps review completed and unfinished work at the end of a Sprint.
- Cycle Time: Measures how quickly work moves from start to completion, helping teams understand delivery speed.
- Cumulative Flow: Helps identify workflow bottlenecks by showing how work moves through different stages.
- Sprint Goal Achievement: Evaluates whether the team successfully delivered the intended outcome of the Sprint.
- Quality Trends: Tracks changes in product quality and reliability over time.
You don’t need every metric.
Atlassian recommends that teams select relevant metrics collaboratively because different teams have different products, workflows, technologies, and goals.
How Metrics Connect to Project Success
The strongest measurement approach combines delivery data with business outcomes.
For example:
Velocity tells you about historical delivery capacity.
Cycle time tells you how quickly work moves through the system.
Burndown shows remaining Sprint work.
Quality metrics reveal product health.
Customer or business KPIs help answer whether the delivered product actually created value.
No single Scrum metric can answer all of these questions.
Final Takeaway
The purpose of Scrum metrics isn’t to make teams produce bigger numbers. It is to make the way they work more visible.
Use velocity to support forecasting, burndown to monitor Sprint progress, cycle time and cumulative flow to uncover workflow problems, and quality measures to protect the product. Most importantly, connect these measurements to Sprint Goals and meaningful business outcomes.
When metrics lead to better questions, better experiments, and better decisions, they become a genuine tool for project success rather than another reporting exercise.
